What is melting here ?

Background

This case study has been generously supplied by the Hitachi Energy Service group in Sweden. A 22 MVA, 10.5 kV/276 V (voltage regulation from 336 to 216 V), Diii furnace transformer, operating in heavy use for many years at a steel melting plant in Europe was subjected to a complete series of tests after a sudden failure during operation. The service contractor evaluated the electrical and dielectric condition of this transformer. During service, this type of transformer has its secondary winding connected externally in a Delta configuration through a high current bridge. To clarify the vector designation, a simple diagram showing its terminals is presented in Figure 1.
Investigation
An outage of a furnace transformer is devastating for the industrial operator. Loss of power results in loss of production. Fortunately, in this case, a spare transformer was available on-site. This afforded an opportunity for the service contractor to perform several tests on the faulted unit, including transformer turns ratio, winding resistance, insulation resistance, and sweep frequency response analysis (SFRA). Additionally, oil samples were taken for laboratory analysis of dissolved gasses in oil (DGA).
„Transformer turns ratio tests were performed with LV excitation from the HV side. A winding connection Dd0 was used for measurement. Transformer turns ratio tests were performed on all taps and acceptable values were obtained for two phases. The test instrument was unable to perform ratio measurements on Phase C. This may have been attributed to a state wherein the impedance was so low that the test instrument was unable to build the excitation voltage configured for the test.
„The transformer turns ratio results are presented in Table 1.
Table 1: Turns Ratio results on all tap positions

Winding resistance tests were then performed on the transformer. Table 2 presents the HV-side winding resistance measurements performed in the factory (RFAT average) and the field.
Table 2: Factory and field winding resistance measurements (HV winding)

Winding resistance results are usually interpreted based on comparing measurements made separately on each phase of a wye-connected winding or between pairs of terminals on a delta-connected winding. A comparison may also be made with original data measured in the factory. A measurement is deemed acceptable, and no further investigation is needed, if the individual phase readings are within 2 % of the other phase readings for three-phase transformers or within 2 % of the reported factory values. When readings are outside the 2 % range, it is recommended to investigate further or to consult the transformer manufacturer to determine the acceptability of the results. However, for very low resistance values, it is not uncommon for measurements to be outside of the 2 % limit even in a perfectly normal transformer. In such cases, the measurement tolerances of test equipment may not be sufficient to resolve the acceptable 2 % limit between measurements [1].
According to IEEE C57.152 [2], values above 5 %, as compared against factory records, should be investigated.
„ I n this case, the factory values were obtained at 24.7 °C and field measurements were made at 28 °C. Correction to factory values is performed as suggested in [2] following equation (1).
Rs=Rm ((Ts+Tk)/(Tm+Tk )) (1)
Rs – Resistance at reference temperature Ts
Rm – Resistance at measured temperature Tm
Tk – 234.5 °C (copper) and 225 °C (aluminium)
The results reveal a mess. The Phase C winding resistance is a concern on Tap position 1 and, as the tap position changes and additional portions of the tap (or regulating) winding are added, the results substantially deteriorate further. Phase A and Phase B test results are unacceptable at higher tap positions too. The significant differences observed in this transformer are better visualised in the resistance measurement plot (Figure 2) and the graphed error, given in % (Figure 3).

The plot in Figure 2 does show an elevated value of winding resistance test results as compared to FAT values but of most significant note is the variation of phase C.
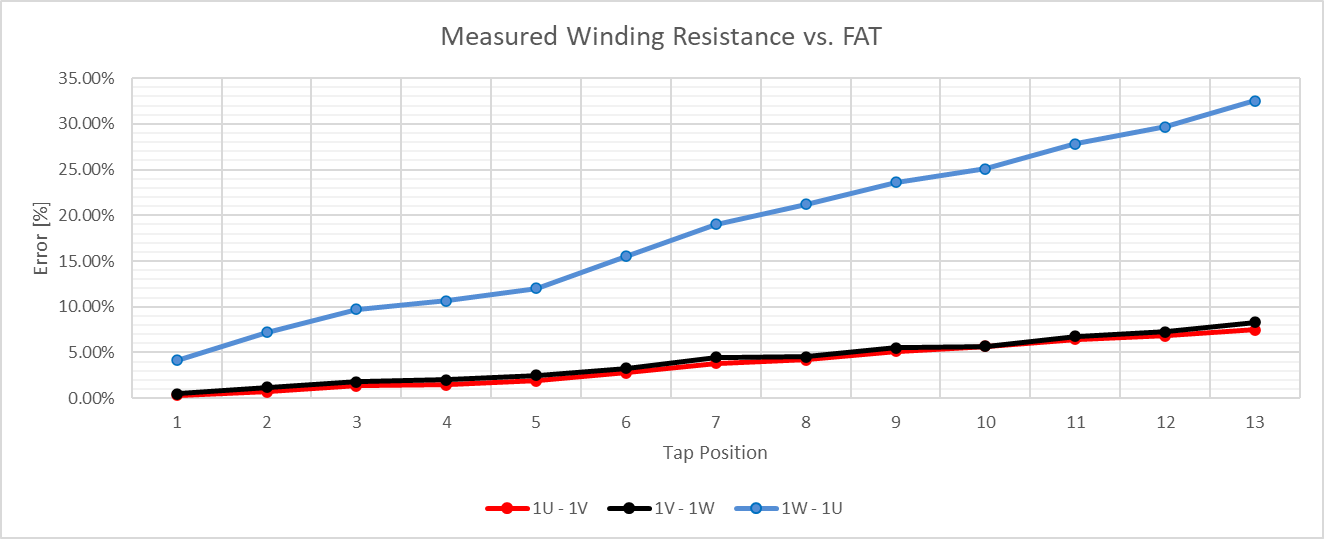
Figure 3: Percentage variation with respect to FAT measurements
Figure 2 shows that phases A and B behave similarly with increasing variation with respect to FAT measurements as the tap position changes. Taps 9, 10, 11, 12, and 13 would unequivocally be considered for investigation as the difference is > 5 %.
Phase C behaves quite differently, exceeding acceptable variation on all tap positions.
Phases A and B were affected by the fault in phase C, as the windings in operation were Delta connected.
Winding resistance test results on the LV side are presented in Table 3. The table provides test results for one section of the LV winding. The other sections of the LV winding yielded similar results.
Table 3: Factory and field winding resistance measurement (LV winding)
| Winding Resistance Measured on the LV side | ||||||||||
| 2U | 2V | 2W | ||||||||
| Tap pos. | RFAT average [mΩ] | RMEAS. [mΩ] | RCORR [mΩ] | ΔRCORR-FAT [%] | RMEAS [mΩ] | RCORR [mΩ] | ΔRCORR-FAT [%] | RMEAS [mΩ] | RCORR [mΩ] | ΔRCORR-FAT [%] |
| 1 | 0.1098 | 0.1127 | 0.1113 | 1.35% | 0.1116 | 0.1102 | 0.36% | 0.1119 | 0.1105 | 0.63% |
Next, the test crew attempted to perform an insulation resistance test at 500 VDC; these results are presented in Table 4.
Table 4: Insulation results obtained at 28 °C
| Capacitance | Energised | Measurement | Test voltage [kV] | IR 60sec [GΩ] |
| CH-(L+G) | HV | LV + Tank | Not possible to measure | |
| CL-(H+G) | LV | HV + Tank | 0.5 | 7.49 |
| C(H+L)-G | HV + LV | Tank | Not possible to measure |
An oil sample was taken from the transformer and sent to a lab for a DGA test. Results are shown in Table 5.
Table 5: Gas concentration from a transformer oil sample
| Test description | Dissolved gas analysis - results provided in ppm | ||||||||
| (O2) | (N2) | (H2) | (CH4) | (C2H6) | (C2H4) | (C2H2) | (CO) | (CO2) | |
| Latest test before failure | 27000 | 59000 | 8 | 2 | 0 | 14 | 0 | 121 | 2290 |
| Test after the failure | 29000 | 64000 | 488 | 214 | 22 | 330 | 408 | 378 | 2710 |
The “latest before failure” DGA test results are not representative of a gassing issue, especially for a furnace transformer. Numbers fall under Condition 1 as specified by existing standards. This is a case where only an on-line gas monitor or a ‘lucky’ oil sample may have detected the incoming arcing fault before failure.
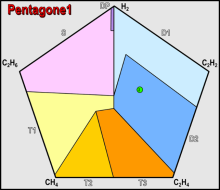
The post failure DGA analysis indicates a D2 position in Duval’s Triangle 1, as well as in Pentagon 1. D2 is an indication of “high energy discharge including arcing. Expected metallic fusion and presence of carbon particles in the oil.” These results are presented in Figure 4.

All evidence clearly pointed to a fault inside the transformer. The remaining question was, where? To localise the fault in the overall active part of the transformer, SFRA testing was carried out using Megger’s FRAX 101.
Figure 5: High voltage open circuit – Tap position 1


Figure 6: High voltage open circuit – Tap position 13
SFRA open circuit test results (Figures 5 and 6) indicate a short circuit in phase C (blue traces). The fault has also affected the other two phases, resulting in a complete asymmetrical response.

Figure 7: High voltage short circuit test
SFRA HV short circuit test results confirm that phase C is affected in this transformer but also that this damaged phase affects the response of phases A and B.
„ There was no doubt that the transformer required major work before returning it to service. To evaluate the extent of the damage identified by this series of tests, the asset owner ordered an internal inspection.
„ During the inspection, the fault was observed on the phase C regulating winding as shown in Figure 8.
„ The A and B phase windings, as well as the core, were unharmed.

Figure 8: Phase C regulating winding as found during visual inspection
The asset owner decided to have the unit repaired. The unit was taken to its manufacturer’s repair shop for full restoration. The repaired unit was put back in service.
The root cause of failure is not 100 % clear. This furnace transformer was in heavy use for many years, with the full power frequently switched on and off. The condition of the transformer was never investigated thoroughly before the fault occurred
Takeaways
During the service life of a power or distribution transformer, it is almost impossible to prevent transient events and through faults that can severely damage the active part of the transformer.
„ After many years in service, especially for furnace transformers, it is beneficial to thoroughly evaluate the operational condition. For service-aged transformers, the operational profile may need to be modified so that the transformer is still able to withstand operational stresses.
- „ After a fault, several actions need to be considered. If the fault was external to the transformer, demagnetise the transformer after isolating it from the system. Remove residual magnetisation in the core to facilitate meaningful interpretation of AC test results, specifically SFRA, excitation, and transformer turns ratio tests.
- If the fault is internal, use low-energy testing practices. Make sure combustible gases are removed from the transformer.
- „ In this case study, electrical and dielectric testing confirmed that C phase winding failed severely, and that the unit could not go back into operation without repair. A spare unit was put in place to minimise downtime operation during the testing and repair of the faulty unit.
- „ The damage in this transformer could have been identified solely by SFRA. Other tests support the findings and help identify the potential root cause of the failure
Benefits
A combination of low-energy testing procedures is always required after a fault condition. On-site availability of SFRA equipment and record of SFRA measurements allow rapid identification of a fault and its location. Other procedures help validate and evaluate the magnitude of the damage.
„ Oil sampling is a good practice when an active failure condition is continuously affecting the regular operation of the transformer. Nevertheless, faults can be rapid and violent, not giving time to the operator to prevent damage to the transformer. Continuous DGA sampling is particularly recommended for heavily loaded transformers, as in the case of this furnace transformer.
„ For the industrial asset owner, loss of power supply is directly proportional to financial losses and non-recoverable production. In this case, a spare unit was available, and downtime was minimised.
„ Be proactive, not reactive. Keep baseline records of the factory and routine test results of your equipment, and make sure that your electrical testing toolbox is equipped with the right tools, especially with an SFRA portable device such as FRAX 101 by Megger.
BIBLIOGRAPHY
[1] “Transformer Service Handbook – 4th Edition” (ABB, 2018, page 189)
[2] IEEE C57.152-2013 “Guide for Diagnostic Field testing of Fluid-filled Power Transformers, Regulators, and Reactors”.
Product references


