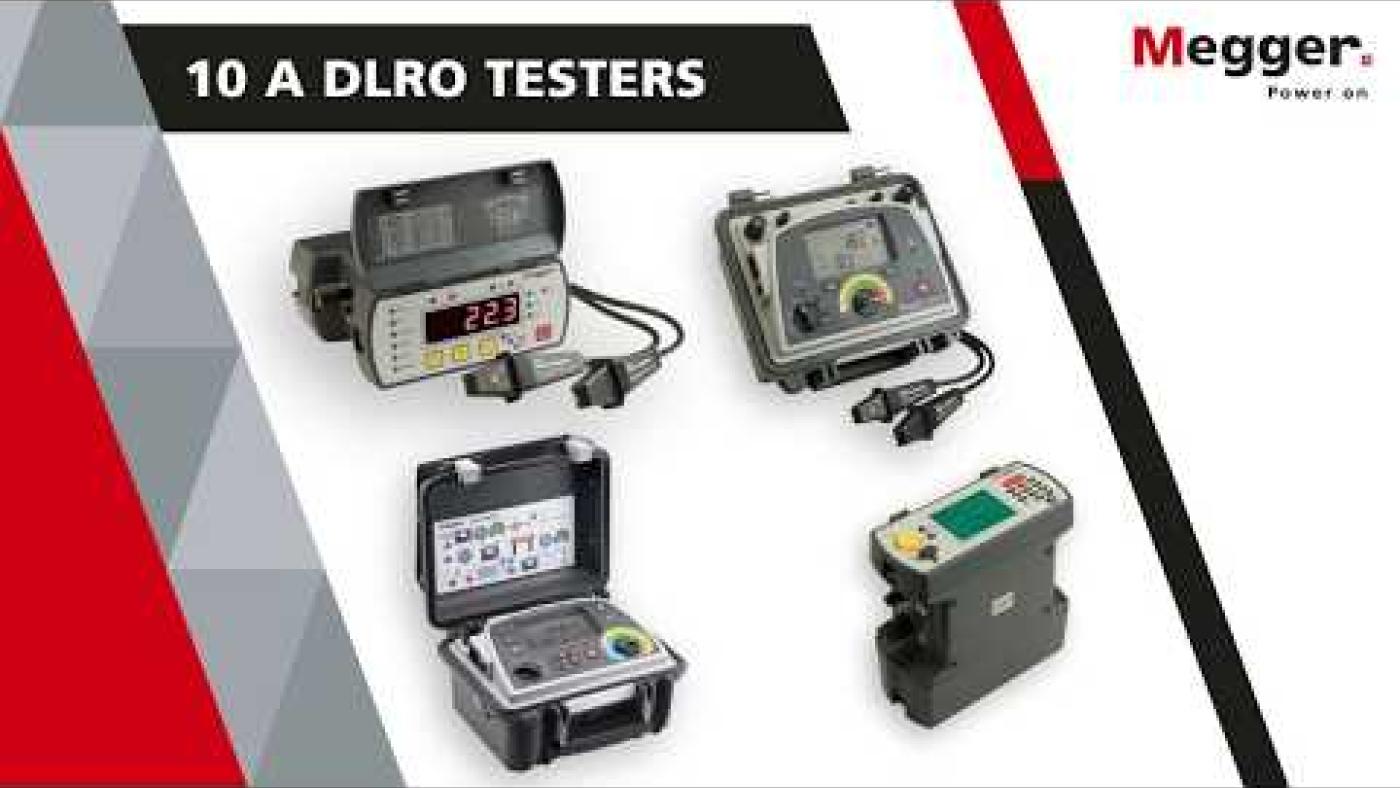
DLRO10 and DLRO10X digital low resistance micro-ohmmeters

About the product
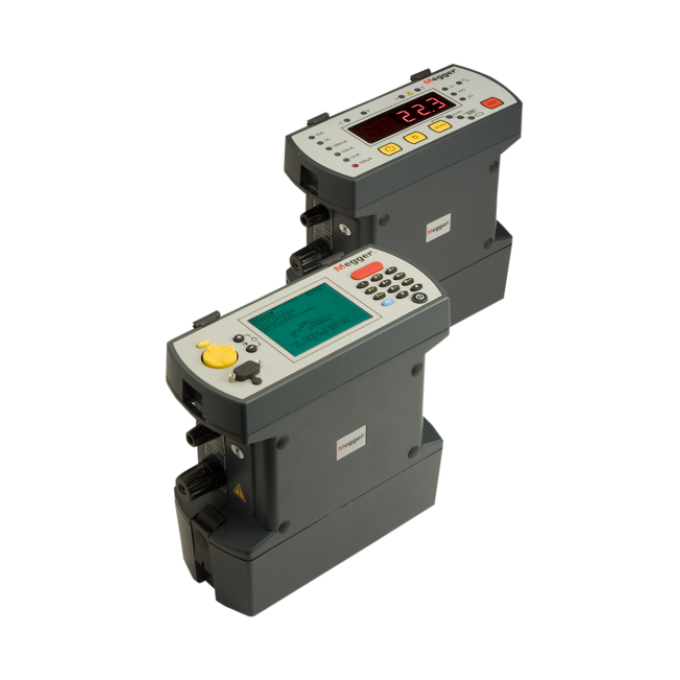
The DLRO10 and DLRO10X digital low resistance micro-ohmmeters bring new standards to low resistance measurement (also known as the Megger ‘Ducter™’ test). Both are fully automatic instruments, selecting the most suitable test current, up to 10 A DC, to measure resistance from 0.1 µΩ to 2000 Ω on one of seven ranges.
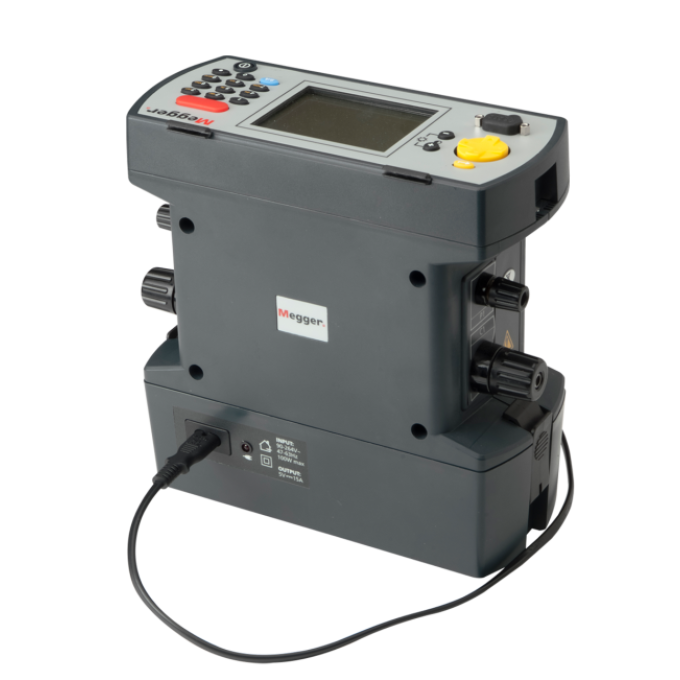
If you desire more control over the measurement process, the DLRO10X uses a menu system controlled by a two-axis paddle to allow you to manually select the test current. The DLRO10X also lets you download results in real time and provides on-board storage for later downloads to a PC.
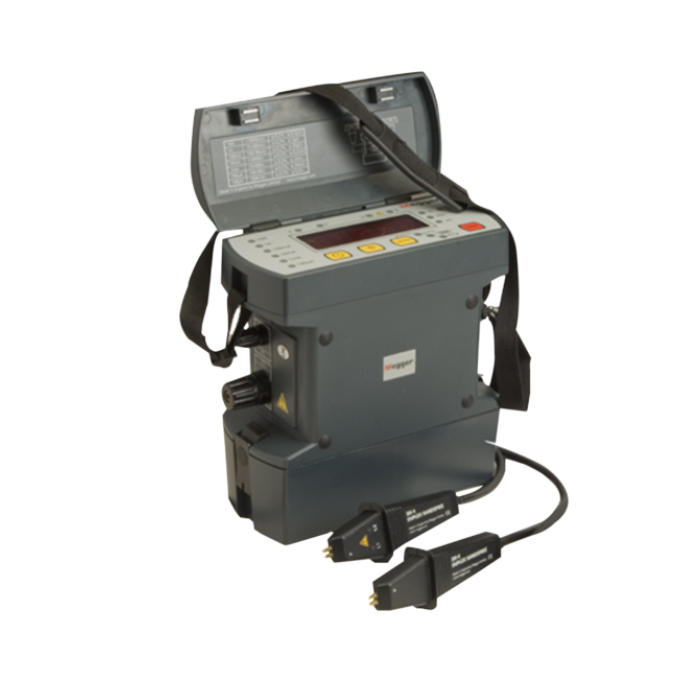
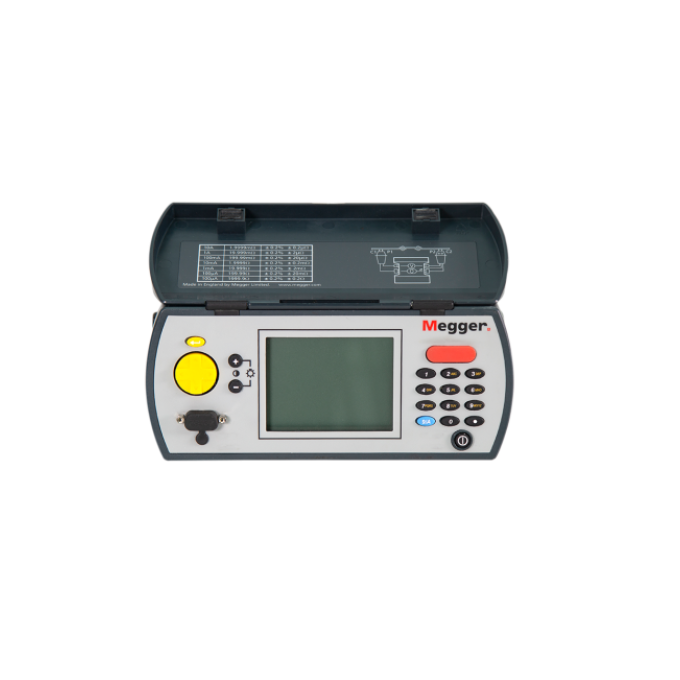
The DLRO10 uses a large, bright 4.5-digit LED display, while the DLRO10X has a large, backlit LCD. Both are visible under all lighting conditions and help reduce errors in reading results.
Both instruments are built into a strong, lightweight case that is equally at home in the field or the laboratory. They are light enough to be worn around the neck, enabling you to take them into areas that were previously too small to access.